Mapping an ecosystem is not listing actors. It means understanding the balance of power, spotting the bridges between communities, and identifying polarising actors. We deliver a consolidated multi-network analysis that is visualised, exportable and replayable.
Ecosystem 360 is built on our SaaS platform Connexia: multi-network extraction, audience triangulation, social network analysis (SNA), community detection and automated visualisation. The tool arms the method, and the method frames the tool.
It is not a directory of influencers. It is a reading of the balance of power: who is central, who bridges communities, which coalitions can be activated, who polarises. Mapping serves the decision, not aesthetics - we never deliver an attractive graph without the decision framework that goes with it.
An Ecosystem 360 comes after, or alongside, a societal audit: the audit identifies the issues, the ecosystem identifies the actors who carry weight on those issues. It is the “Understand” building block of our cycle.
Mapping costs money. Mapping badly costs twice as much. Ecosystem 360 creates value when the decision that follows justifies the investment.
To identify the decision-makers who can be engaged directly, the coalitions to build, and the bridge actors to cultivate before approaching a ministry.
When the issue is beyond the capacity of a single organisation: identify those who can be aligned, the undecided and the antagonists, and structure the approach.
For a sector that is taking shape (AI, green tech, crypto...), spot the actors who structure the conversation before they become unavoidable.
To understand quickly who is speaking, who is driving, who is amplifying, and to calibrate the response accordingly.
Every ecosystem starts with a list: 25 to 30 starting actors (seed list) that the client already knows - decision-makers, influencers, media, competitors, potential allies. This list does not need to be exhaustive; it needs to be representative.
Quality work starts here. A seed list that is too homogeneous produces a narrow ecosystem that confirms the client's intuition. A diversified seed list (sector profiles, politicians, journalists, academics, NGOs, competitors) produces an ecosystem that reveals blind spots.
We systematically challenge the list proposed by the client before launching the extraction. It is the most underrated step, and the one that determines the quality of everything that follows.
The list of names becomes usable once each actor is linked to their accounts on LinkedIn, X, Instagram, YouTube. This is the Canal Assessment: a semi-automated process that surfaces the profiles, checks authenticity (verification badges, namesakes, parody accounts) and assesses real activity.
This step is more delicate than it looks. Many decision-makers have several accounts, some of them dormant, personal and institutional accounts, and parody accounts that pollute the extractions. The Canal Assessment produces a clean reference base that conditions everything that follows.
Output: a reference file with, for each actor, their verified URLs, activity status and relevance score. Connexia then uses this file to extract the public data.
Triangulation is the mathematical heart of the method. For each pair of actors, Connexia calculates: shared audiences (who follows both?), cross-engagements (who likes, comments, shares?), thematic co-occurrences (do they talk about the same subjects?).
The result is a dense matrix of relationships that feeds a directed graph. Two actors do not need to follow each other to be linked: the fact that the same community of followers follows both of them is enough to create an exploitable statistical link.
This approach reveals proximities that are invisible to the naked eye: one think tank shares 40% of its audience with a given trade union, even though neither follows the other. This is the kind of insight that shapes an alliance strategy.
On the activist ecosystem of a French food manufacturer, triangulation showed that several collectives presented as independent in fact shared a common audience core of several thousand accounts - a sign of unacknowledged underlying coordination. This reading made it possible to calibrate the crisis cell: offensives that appear isolated are anticipated as correlated sequences, not as independent events.
Social network analysis (Social Network Analysis) on the graph produced by triangulation reveals the hidden structure of the ecosystem. Three main readings: community detection (Louvain clustering), centrality measures (degree, betweenness, closeness), connector identification (actors who bridge communities).
Community detection is particularly telling: it brings out coherent groupings that reflect ideological, sectoral or territorial affinities. A typical French parliamentary ecosystem will yield 5 to 8 readable communities (political groups, thematic sensibilities, territorial groupings).
Connectors (actors with high betweenness) are the most valuable strategic targets: engaging them means being able to reach several communities at once. Identifying them often changes an influence strategy radically.
For a trade federation supported on a sensitive legislative file, the SNA brought to light three MPs who were not rapporteurs - and therefore invisible to the conventional public affairs radar - and who acted as a bridge between the majority, groups of academic experts and grassroots associations. Engaging them first made it possible to open hearings faster than through the formal route of the rapporteurs.
Highly central actors, close to your positions. Priority target for direct activation: outreach, co-construction, visibility.
Influential actors who hold antagonistic positions. Strategy: understand their motives closely, avoid direct confrontation, and build documented counter-narratives.
Sympathetic but not very influential actors. Strategy: cultivate them, equip them with content, help them rise. A long-term investment.
Opposing but marginal voices. Monitor, but do not over-react. They become a priority only if a central actor starts relaying them.
A raw graph is not a deliverable that can be used in committee. Visualisation is a work of storytelling. We produce three layers: maps per network (LinkedIn, X, etc.), a merged multi-network map (the 360 view), and ID Cards per community.
ID Cards are summary sheets, one per detected community: Who (key actors), What (dominant themes), Why (what binds them), Activation recommendation. It is the deliverable clients use most - it turns the graph into an action plan.
Everything can be exported in GEXF (Gephi format) for clients who want to explore interactively, or continue with a data scientist. Full traceability (versioning, intermediate validations) makes it possible to replay or update the analysis at any time.
On public affairs engagements, the ID Cards per community feed directly into the advocacy kit: position papers calibrated by sensibility, prioritised parliamentary contact plans, and talking points tailored to each audience. The graph does not remain an object of abstract analysis; it becomes the backbone of activation.
Two proprietary SaaS platforms arm the method and work together. Connexia is the core: multi-network extraction, calculation of relationship matrices, social network analysis, visualisation, and conversational monitoring of the communities detected - who speaks, when, at what intensity, with which narratives. Follaw.sv enriches the graph with the parliamentary layer (active parliamentarians, co-amendments, the HATVP register of interest representatives) - indispensable when the ecosystem touches on legislative issues.
This triangulation of tools is what keeps the ecosystem alive rather than frozen. A static map ages within a few months; an integrated set-up makes it possible to detect who is rising, who is moving between communities, who is becoming a connector. On activist ecosystems, it is this continuous updating that separates a one-off study from a genuine steering tool.
Market tools (Meltwater, Onclusive, Visibrain, Brandwatch) cover part of the scope, but none combines multi-network extraction, SNA, real-time monitoring and parliamentary intelligence in a single pipeline. It is this integration that produces cross-layer insights.
A minimum of 25-30 actors to start the triangulation. On major sector issues, we have handled ecosystems of over 500 accounts (example: study on SBF companies). The useful size depends on the density of the sector, not on a fixed rule.
A stable ecosystem (institutional, mature sector) remains usable for 12 to 18 months. A shifting ecosystem (emerging tech, controversial topic) can move within 3 to 6 months. We offer a focused or full update depending on need.
The radar looks at your current audience (who follows you). The ecosystem looks at your universe of influence (who carries weight on your issues). Combining the two reveals the strategic gaps: influential actors you are not yet reaching.
Yes, explicitly. Detailed Excel files for analysts, PowerPoint for decision-makers, GEXF for data scientists. We also run a handover workshop so that in-house teams can replay or extend the analysis.
Let's discuss your strategic challenge. No-commitment first conversation.
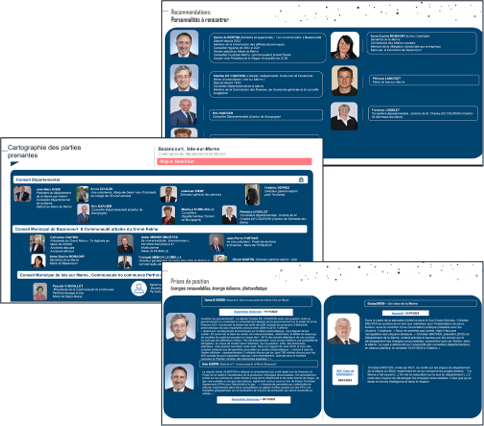
People to meet, linked to their territories and their areas of influence.
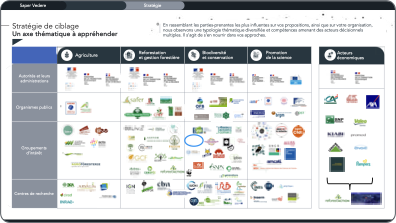
Prioritised thematic axes and the stakeholders associated with each axis.
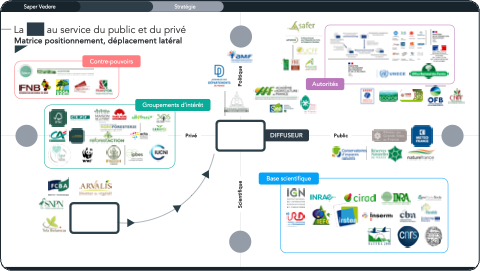
Public / private framing: counter-powers, interest groups, scientific base.
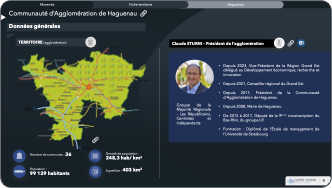
Demographic data, portrait, territorial issues - one sheet per key actor.
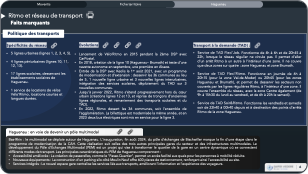
Sector policy (here, transport) cross-referenced with the territory's key events.
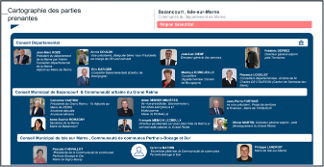
A condensed view of the ecosystem: the influence nodes to activate first.